Splunk Dashboard for Web Traffic Logs
Building a Real-Time Web Activity Monitoring Dashboard
Overview
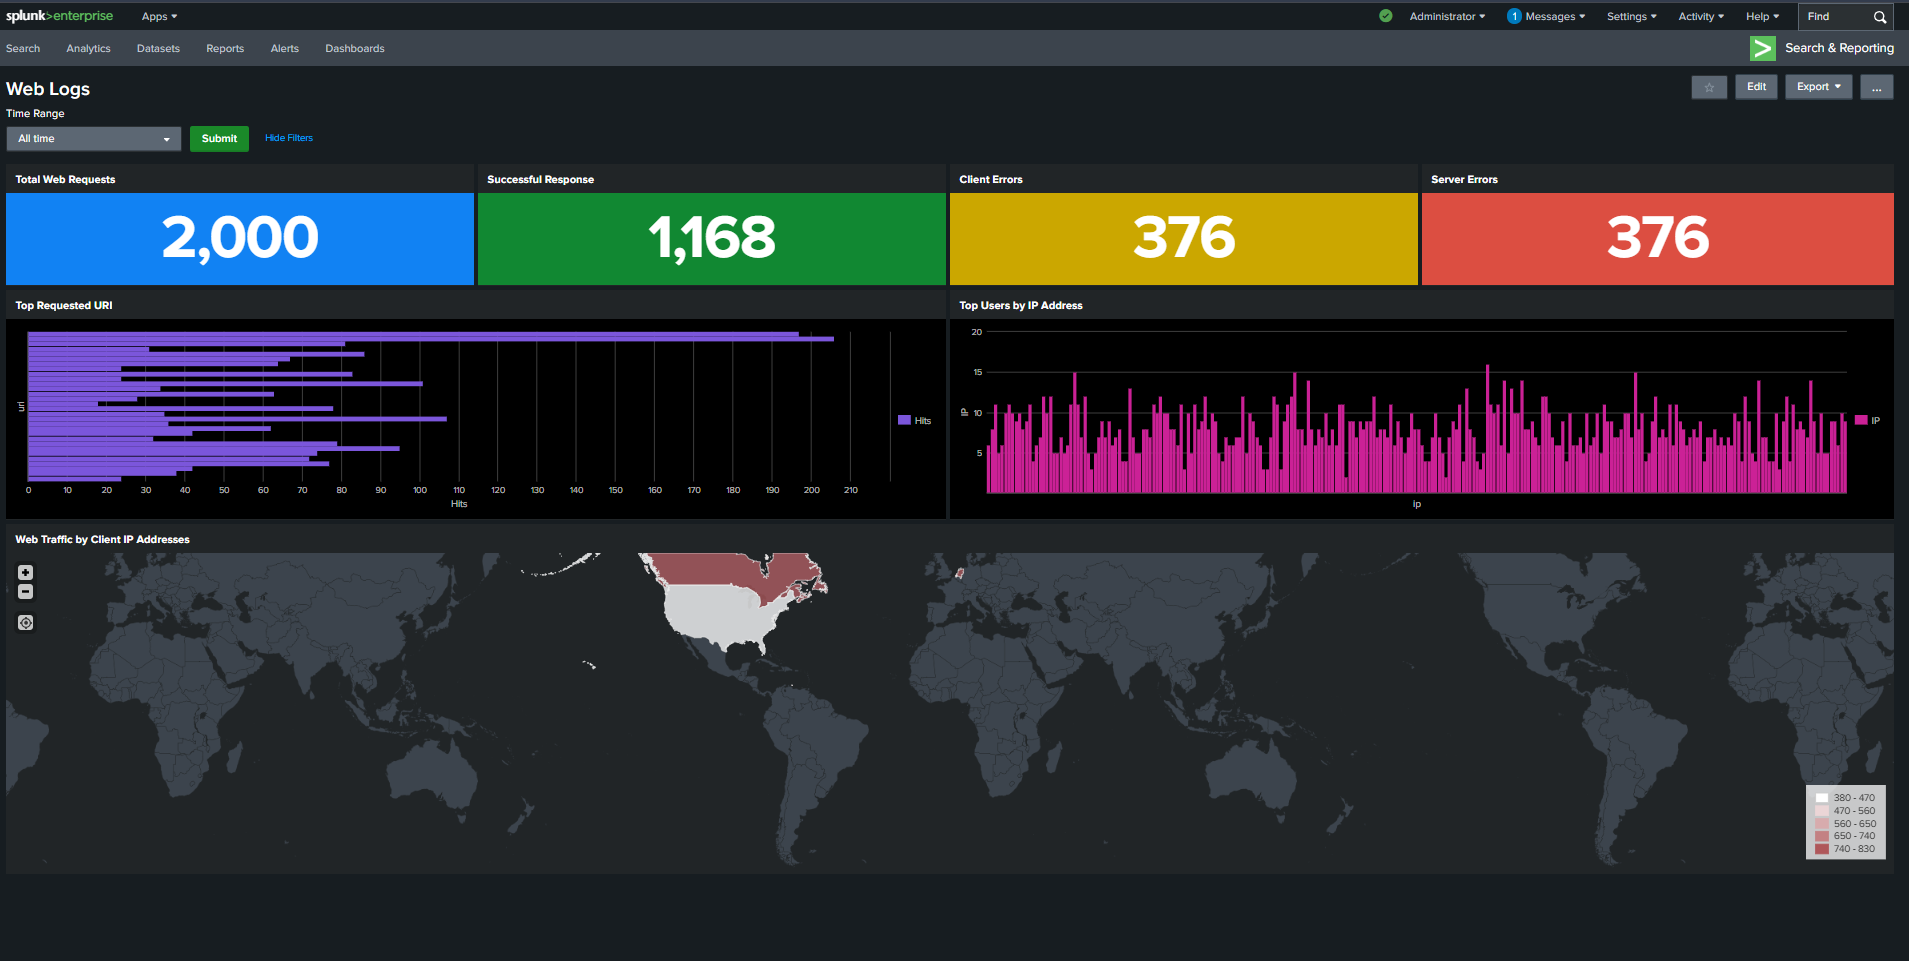
In this project, you’ll create a Splunk dashboard to monitor and visualize web traffic logs.
You’ll track HTTP requests, success and error rates, popular URIs, and client IP activity.
The dashboard will include single-value panels for key metrics, bar charts for top endpoints, and a geo-map for visualizing client locations.
This hands-on project helps you understand user activity and detect web anomalies in real-time.
What You'll Learn
-
Splunk Dashboard Design
Build an interactive dashboard with multiple visualization types including single-value metrics, bar charts, and geo-maps.
-
Web Log Analysis
Understand web server activity from Apache-style access logs and interpret key fields like method, status, uri, and ip.
-
Error Pattern Detection
Identify client-side (4xx) and server-side (5xx) errors for performance and reliability insights.
-
Geo-Visualization
Map global user traffic and identify where requests originate using Splunk’s iplocation and geom commands.
Prerequisites
- Basic understanding of HTTP methods and response codes
- Access to Splunk Enterprise or Splunk Cloud instance
- Sample Apache web access log in JSON format
Lab Environment
Experience hands-on learning with our carefully designed lab environment that mirrors real-world scenarios.
- Real-world tools and interfaces
- Step-by-step guided instructions
- Interactive lab environment
- Hands-on practice with live systems
About Trainer

Rajneesh Gupta
Rajneesh Gupta is a seasoned cybersecurity professional with over 11 years of industry experience. With a remarkable career focused on incident response, penetration testing, security compliance, and risk management, Rajneesh has established himself as a leading expert in the field. He is also an accomplished author, having penned the book "Hands-on with Blockchain and Cybersecurity". As a dedicated educator, Rajneesh has made a significant impact on the cybersecurity community by training over 60,000 students globally.
Related Projects

Apache Server Log Analysis using Splunk
Detecting Brute Force, SQL Injection, XSS, and Suspicious Web Activity from Apache Access Logs with Splunk SIEM
Practical AWS Cloud Security Posture Assessment Using Scout Suite
Identify real-world AWS attack surfaces through visual security posture analysis.

Wazuh + n8n + Anyrun: Automated Malware Analysis
Automate malware analysis by sending Wazuh-detected suspicious files into ANY.RUN, retrieving detailed reports and IOCs, and integrating results back into your SOC workflow.